Analysis
Large-scale data center facility (source: McKinsey & Company)
This image illustrates the physical scale and infrastructure required to support growing global demand for data centers, which is expected to expand rapidly alongside AI and digital services.
Environmental Impact & Motivation
Data centers are among the most energy- and water-intensive buildings in the world. They consume 10-50x more electricity than a similarly-sized office building. In Ireland, data centers consumed 21% of national electricity demand in 2024. In the U.S., data centers consumed 17 billion gallons of water in 2023 for on-site cooling. Therefore, companies looking to cut costs hunt for cheap electricity and relaxed environmental rules.
Research Questions & Dataset Context
Our team decided to research the negative impacts of data centers on the environment and on their local populations through excessive energy usage. We also want to see whether data centers use renewable energy, and whether or not this can be optimized to minimize the negative impact of data centers on the environment. For some context, data centers are secured facilities that are used to power computers and technological systems. However, with the growing use of AI, they also are now used for this purpose, and consume exponentially more energy than before. Our rationale is based on our research, and on a Global Data Centers dataset we found through Kaggle. This dataset shows information about data centers for each individual country around the world, such as the number of data centers and hyperscale data centers, power capacity, and average renewable energy. These statistics directly correlate in answering some of our research questions, and give us more insight on how data centers work in different types of countries (such as first world vs. developing ones). In 2024, the United States alone housed over 5,400 data centers, while the entire continent of Africa operated fewer than 150. This disparity is not merely due to technological problems. However, it reflects a deeper structural imbalance in who owns, accesses, and benefits from the infrastructure underlying the global digital economy. This project asks, “how does the unequal global distribution of data center infrastructure reflect and reinforce digital inequalities?” The dataset for the project has 23 variables including total data center counts, hyperscale facility presence, internet penetration rates, average latency to global hubs, and fiber connectivity. This project visualizes the relationship between where the data centers are concentrated and the degree of digital connectivity that the population actually experiences. A preliminary analysis of the data shows a positive correlation between data center presence and internet penetration. It shows huge contrast between countries, with no data centers as an average of only 48% internet penetration, while those with over 100 average nearly 88%. The articles suggest that the global data center landscape is not simply uneven but structured by the same historical forces of capital accumulation and colonial extraction that have shaped prior industrial development.
Literature Review & Scholarly Context
Studies agree that data centers’ geographical concentration is neither accidental nor neutral, but shaped by political economic forces that reproduce existing inequalities. Pickren argues that the physical infrastructure of big data tends to cluster on top of existing industrial networks that exploit path dependencies in energy systems and transportation routes from previous eras of capitalist expansion (‘The global assemblage of digital flow’: Critical data studies and the infrastructures of computing, 2018). Brodie extends this to a global scale, framing data centers as infrastructures of environmental colonialism where multinational corporations use public energy through corporate contracts and local populations bear the cost (Data infrastructure studies on an unequal planet, 2023). Martin and Dogar shift from theory to empirical measurement which demonstrates that cloud providers’ deployment of edge data centers actually widens the digital divide. Inequality between the closest and farthest users doubles on most continents when edge locations are added, and their concentration index analysis shows that wealthier areas systematically receive closer data center access, with Africa scoring the highest unfairness globally (Divided at the Edge – Measuring Performance and the Digital Divide of Cloud Edge Data Centers, 2023). When looking through articles in our literature review, we found that most sources agree with the negative viewpoint towards data centers because of the sheer amount of energy they consume. For example, the article “Generative AI is Guzzling Water and Energy” discusses how OpenAI’s chief executive Sam Altman publicly admitted that AI’s effects on energy systems are massive, and how in the next few years, AI will begin needing as much power as entire nations. They also discuss potential renewable energy solutions that can be practiced, stating that, “In industry, sustainable practices should be imperative, and should include measuring and publicly reporting energy and water use; prioritizing the development of energy-efficient hardware, algorithms, and data centres; and using only renewable energy” (Crawford, 2024). Furthermore, the article “The Carbon and Water Footprints of Data Centers and What This Could Mean for Artificial Intelligence” quantifies this energy consumption, stating that “The carbon footprint of AI systems alone could be between 32.6 and 79.7 million tons of CO2 emissions in 2025, while the water footprint could reach 312.5-764.6 billion L” (Vries-Gao, 2026). Overall, these articles and scholars generally agree about the negative impacts of AI. This directly correlates to our research about data centers, since data centers are integral for generative AI, and thus are consuming massive amounts of energy to continue to power generative AI. Preventative measures to stop the public from using AI have not been explored yet, which leads to the question: What environmentally conscious measures can be taken to stop the mass negative effects of power consumption by data centers for AI?
Significance
Why should you care?
Data centers are rapidly becoming the foundational infrastructure of the 21st-century economy. However, the distribution of this infrastructure remains profoundly unequal. We worked on visualizing the global relationship between data center distribution and digital access because we want to find out whether the quantitative patterns across 191 countries confirm the theoretical arguments of the studies so that we can help others understand that the digital inequalities are not simply a matter of internet access but an infrastructural condition rooted in the same dynamics of uneven development and extraction that have shaped global inequalities for centuries. By bringing together a global dataset with humanistic interpretation on infrastructure inequality, it offers a data-driven visualization that maps an inequality often discussed in abstract, theoretical terms but rarely examined at a global scale. Furthermore, AI is a very new and upcoming concept that people are still familiarizing themselves with. Though data centers have been around for a while and some people have strong opinions on them, we have yet to see the mass effects that AI will have on local communities. Our research on this topic visualizes how data centers will shape the future by looking at current trends. We will also indicate trends, such as which countries and major companies will contribute the most to energy consumption, and thus, in turn, be able to target these groups in order to combat this excessive energy usage. As aforementioned, this work is connected to other larger questions about AI, such as what the world will look like in a few years now that people use AI in their everyday lives, and how vast will the environmental effects be. We want to help others understand how data centers shape AI usage and general power consumption, as well as how much energy is consumed with them.

This choropleth map visualizes the average renewable energy usage in data centers, with color intensity representing higher or lower percentages across countries.
The map shows that the environmental impacts of data centers are not evenly distributed across the world. The use of renewable energy in data centers differs greatly between countries, with some areas adopting renewable sources at substantially higher rates than others. These disparities show how economic and policy factors influence environmental practices and imply unequal access to sustainable infrastructure. The renewable energy percentage indicates how much of the energy used by data centers comes from renewable sources. While higher percentages generally suggest more sustainable energy practices, they do not necessarily mean that overall environmental impacts are low, since countries with large numbers of data centers may still consume significant amounts of energy. These patterns’ geographic distribution contributes to the identification of environmental disparities associated with global digital infrastructure.

This map shows the average tier of the data centers in a country.
The countries with the highest average tier of data centers are in the Caribbean, with the Dominican Republic and Antigua and Barbuda having an average of tier 4. Other notable countries with high average data center tiers are Iceland, Finland, Denmark, Angola, Comoros, Brunei, and New Zealand. Countries with a high average data center tier may not be correlated with high GDP or internet penetration. The most prominent countries, like the US, China, and others, have a relatively lower average data center tier. This is because there are many more data centers in these countries, while the smaller countries have only 1 or 2 large, modern data centers.

This chart is a scatterplot showing the relationship between the number of hyperscale data centers and the total number of data centers in a country, with the color of each point indicating the average percentage of renewable energy usage in the country.
Since the US is a vast outlier, it was removed as a data point, allowing us to view the relationships for other countries. In general, less than 1 out of 10 data centers are considered hyperscale. We see that countries with higher renewable energy usage have less hyperscale and total data centers. Singapore stands out as a country with high renewable energy usage while also having more than 1 out of 10 data centers being hyperscale.

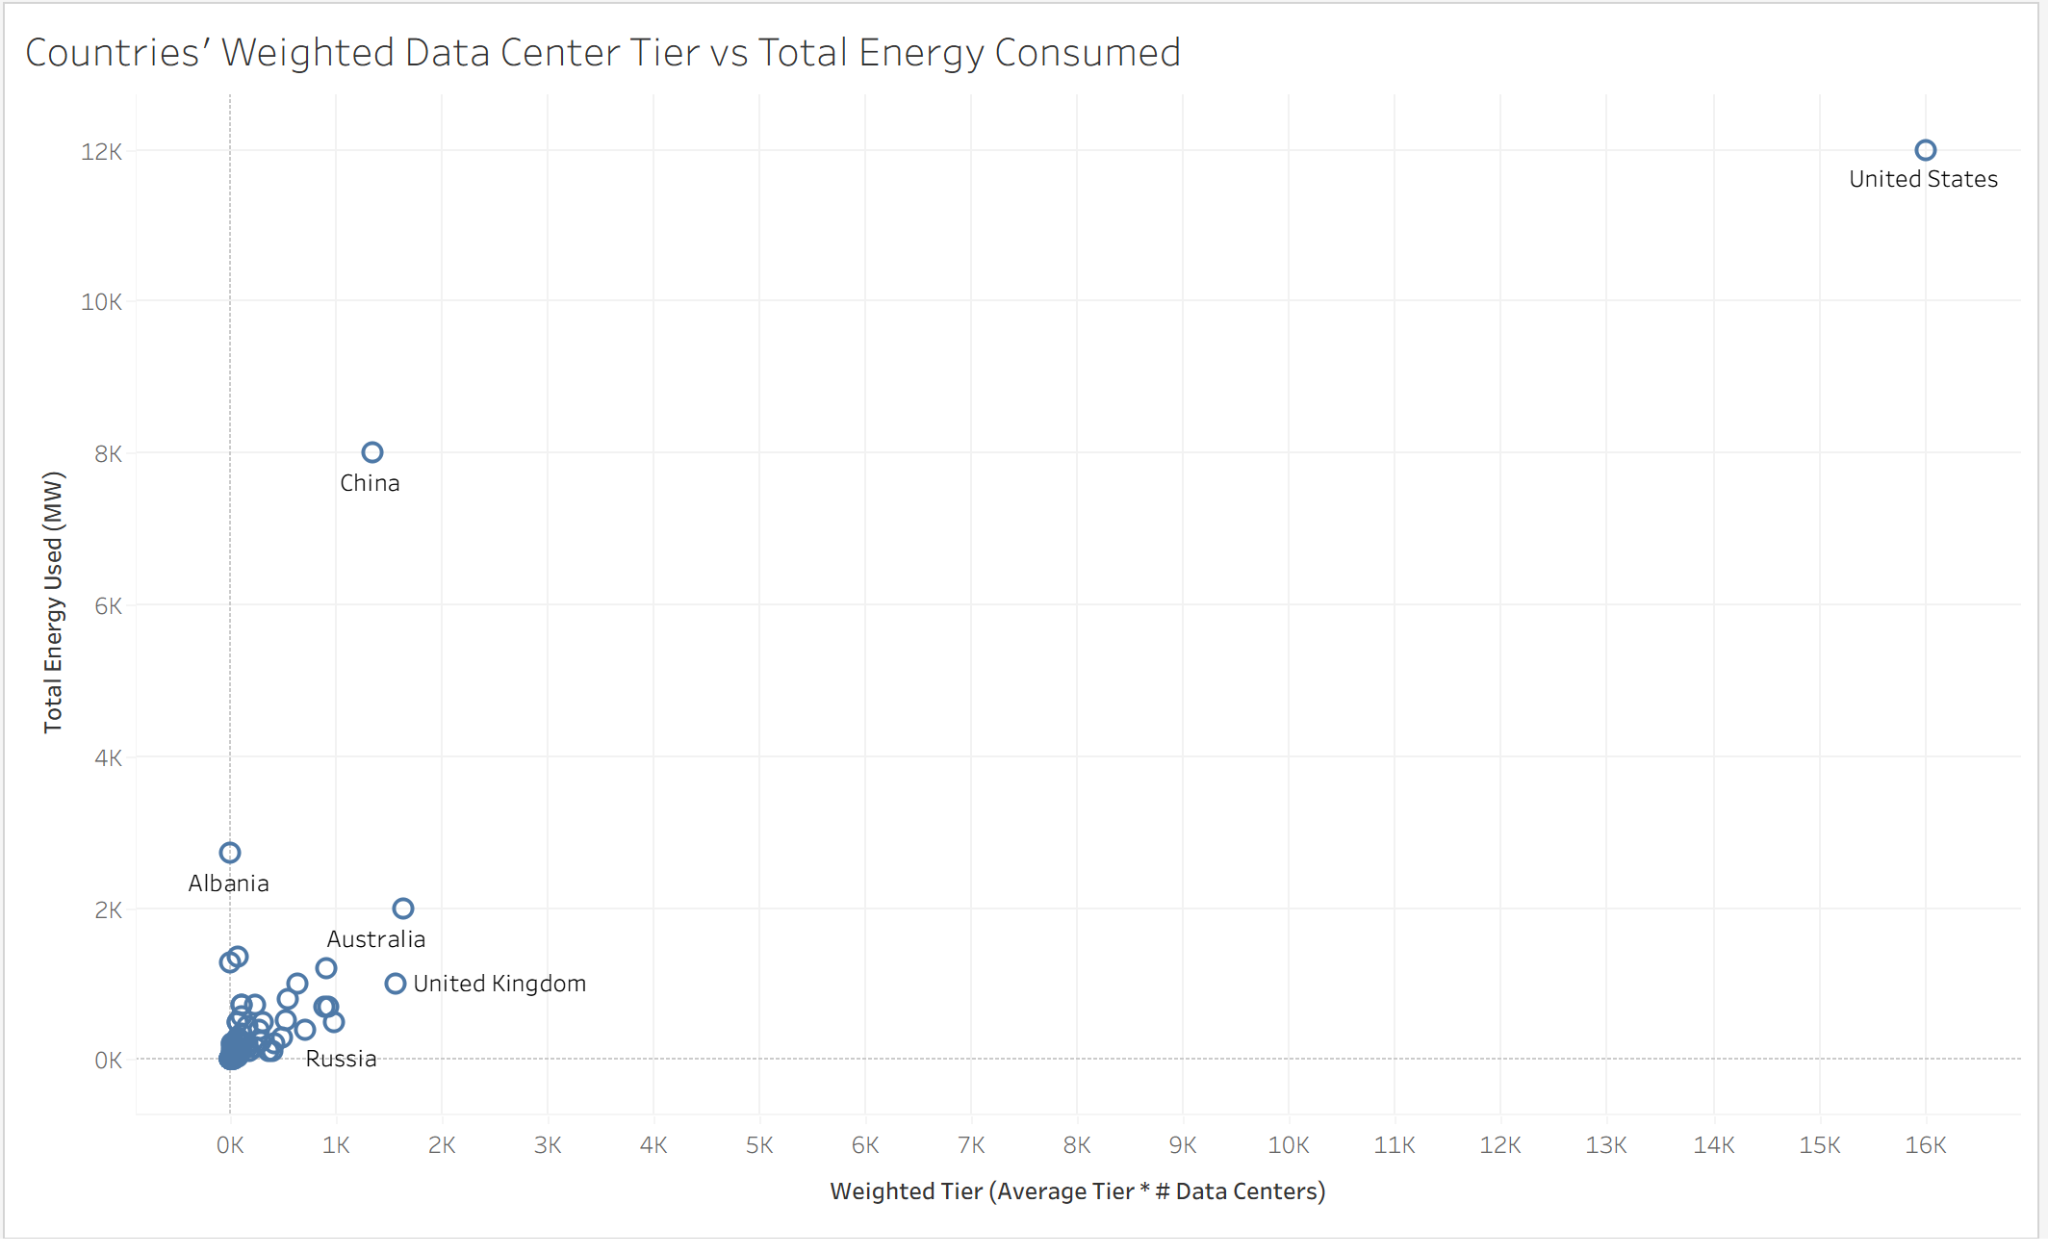
This chart is a scatterplot showing the relationship between each country’s weighted tier of data centers and the total energy consumed by data centers (in MW). Countries where the total energy consumed is unknown are excluded. Weighted Tier is the product of the average data center tier in the country and the number of data centers it has.
Note: the US is not present here, but there is a scatter plot with the US for reference
Data center tiers are measures of the reliability and uptime of data centers, split into tier 1 to 4, with 4 being the most robust. The weighted tier of a country is a good measure of a country’s level of infrastructure in terms of data centers. The visualization shows that a higher Weighted Tier doesn’t correlate with an increase in Total Energy Used, aside from exceptions like the US and China. This means that the energy consumption of data centers can be distributed, since an increase in the number of data centers doesn’t correlate with an increase in energy consumption. So when a data center has too much impact on the local population due to its energy consumption, the burden of energy can be distributed to areas that are more capable of handling the consumption. Overall, this will reduce the negative impact of data centers on their local population while maintaining the energy usage needed to maintain infrastructure. Furthermore, since an increase in average tier doesn’t correlate with an increase in energy consumption, making data centers more robust (increasing their tier) is a good option to improve performance without too much of a negative impact.

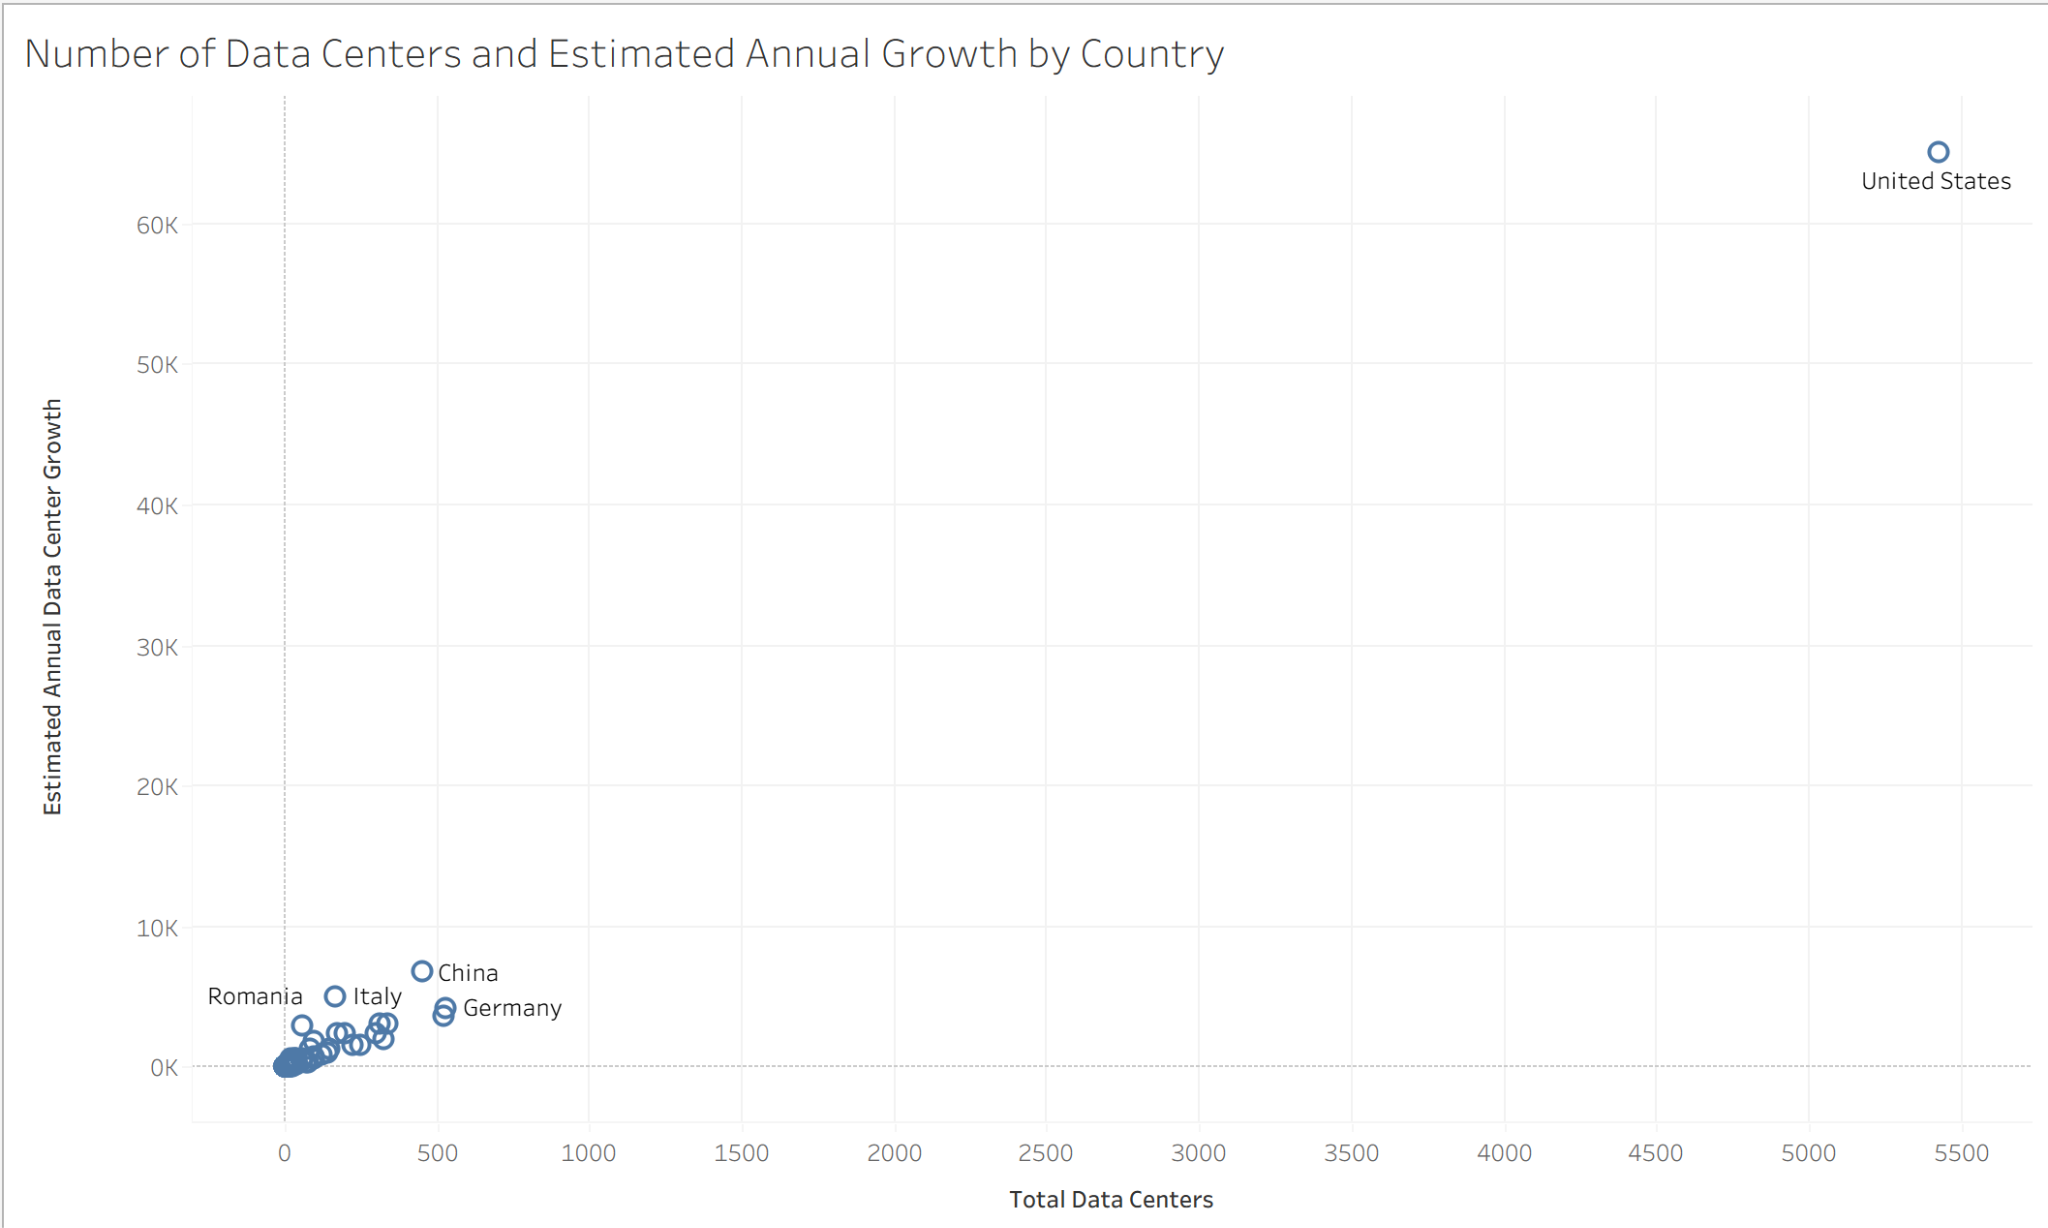
Sum of all estimated annual growths: 127,364 data centers / year
Note: the US is not present here, but there is a scatter plot with the US for reference
The scatter plot reveals a global data center landscape where a small group of nations such as China, Germany, UK and Australia dominate both existing infrastructure and projected growth. However, the vast majority of countries cluster near the origin, with fewer than 50 data centers and minimal growth rate. This concentration becomes even more extreme when the United States is included and its 5,400 facilities and 63,000 estimated annual growth compress every other nation into the bottom left corner.

This data visualization reveals a correlation between data center presence and internet penetration. The sharpest drop occurs at the bottom of the distribution, where the difference between having no data center and having even one corresponds to a 10% gap in connectivity. However, there was almost the same internet penetration with 21 to 100 and over 100 data centers. This supports the idea that data infrastructure is not neutral but embedded in geopolitical and economic hierarchies where large pools of capital, regulatory regimes and existing technological ecosystems cluster together to produce places of abundance and places of scarcity (Brodie, 1). The chart illustrates the gradient of human opportunity shaped by who builds infrastructure, where, and for whom.
What the chart cannot show is how these disparities are experienced and what they persist. The study demonstrates that when cloud providers deploy new edge data centers inequality between the closest and farthest users doubles on most continents because new facilities launch in already well served cities rather than underserved regions (Martin and Dogar, 10). In Africa, about half of users reach the 20-millisecond latency threshold needed for AI and VR application but another 40% remain standard above 40 milliseconds and the continent scores the highest unfairness globally in their concentration index (Martin and Dogar, 13). Also, Infrastructure rich regions extract value and offload environmental costs onto infrastructure poor ones. For example, in Ireland, data centers consumed 14% of the national grid in 2021 while nearby rural residents lacked broadband and burned carbon fuels for heat (Brodie, 5). These reveal that data center distributions are both a symptom and cause of unequal digital life. Until the infrastructure of the digital economy is governed as a matter of public equity rather than private profit, this trend will continue to reflect not just a technological gap but a fundamentally human one.
Conclusion
There are many negative effects of data centers due to their excessive usage of energy. However, there are many solutions that mitigate their negative impact. For example, clean energy alternatives are continuing to be found as alternatives for fossil fuels powering AI (AI’s Appetite for Energy: How Data Centers are Affecting the Environment). Singapore introduced an IMDA Energy Efficient Grant in order to reduce energy consumption of IT equipment, while Germany passed an Energy Efficiency Act, which limits the power usage effectiveness of data centers. Overall, though data centers are a growing problem, especially with the emerging use of AI, countries are starting to create initiatives in order to combat their harmful effects.